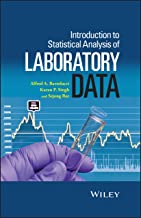
Introduction to Statistical Analysis of Laboratory Data
Original price was: ₹10,036.00.₹8,028.80Current price is: ₹8,028.80.
ISBN: 9781118736869
Author/Editor: Alfred Bartolucc
Publisher: John Wiley
Year: 2015
1 in stock (can be backordered)
Description
Introduction to Statistical Analysis of Laboratory Data presents a detailed discussion of important statistical concepts and methods of data presentation and analysis * Provides detailed discussions on statistical applications including a comprehensive package of statistical tools that are specific to the laboratory experiment process * Introduces terminology used in many applications such as the interpretation of assay design and validation as well as fit for purpose procedures including real world examples * Includes a rigorous review of statistical quality control procedures in laboratory methodologies and influences on capabilities * Presents methodologies used in the areas such as method comparison procedures, limit and bias detection, outlier analysis and detecting sources of variation * Analysis of robustness and ruggedness including multivariate influences on response are introduced to account for controllable/uncontrollable laboratory conditions
Additional information
| Weight | 0.556 kg |
|---|
Product Properties
| Year of Publication | 2015 |
|---|---|
| Table of Contents | Preface xi Acknowledgments xv 1 DESCRIPTIVE STATISTICS 1 1.1 Measures of Central Tendency 1 1.2 Measures of Variation 4 1.3 Laboratory Example 7 1.4 Putting it All Together 8 1.5 Summary 10 References 10 2 DISTRIBUTIONS AND HYPOTHESIS TESTING IN FORMAL STATISTICAL LABORATORY PROCEDURES 11 2.1 Introduction 11 2.2 Confidence Intervals 19 2.2.1 Confidence Interval (CI) for the Population Mean The t-Distribution 20 2.2.2 Confidence Interval for the Variance and Standard Deviation 21 2.3 Inferential Statistics Hypothesis Testing 23 2.3.1 t-Test for Means 25 2.3.2 Test for Variation: Coefficient of Variation (CV) 28 2.3.3 Two-Sample Test of the Population Means 29 2.3.4 One-Way Analysis of Variance (ANOVA) 34 2.3.5 Nonparametric Tests for Skewed Data 40 References 41 3 METHOD VALIDATION 43 3.1 Introduction 43 3.2 Accuracy 45 3.2.1 Method 1 45 3.2.2 Method 2 56 3.3 Brief Introduction to Bioassay 59 3.3.1 Direct Assay 59 3.3.2 Indirect Assay 61 3.4 Sensitivity, Specificity (Selectivity) 69 3.5 Method Validation and Method Agreement Bland-Altman 73 References 76 4 METHODOLOGIES IN OUTLIER ANALYSIS 79 4.1 Introduction 79 4.2 Some Outlier Determination Techniques 80 4.2.1 Grubb Statistic 82 4.2.2 Other Forms of the Grubb Statistic 84 4.2.3 Studentized Range Statistic 85 4.2.4 Sequential Test of Many Outliers 86 4.2.5 Mahalanobis Distance Measure 88 4.2.6 Dixon Q-Test for a Single Outlier 91 4.2.7 The Box Plot 94 4.2.8 Median Absolute Deviation 95 4.3 Combined Method Comparison Outlier Analysis 96 4.3.1 Further Outlier Considerations 96 4.3.2 Combined Method Comparison Outlier Analysis Refined Method Comparisons Using Bland Altman 98 4.4 Some Consequences of Outlier Removal 103 4.5 Considering Outlier Variance 104 4.5.1 The Cochran C test 104 4.5.2 Cochran G Test 107 References 110 5 STATISTICAL PROCESS CONTROL 113 5.1 Introduction 113 5.2 Control Charts 115 5.2.1 Means (X-bar) Control Charts 117 5.2.2 Range Control Charts 122 5.2.3 The S-Chart 124 5.2.4 The Median Chart 126 5.2.5 Mean (X-bar) and S-Charts Based on the Median Absolute Deviation (MAD) 128 5.3 Capability Analysis 131 5.4 Capability Analysis An Alternative Consideration 137 References 139 6 LIMITS OF CALIBRATION 141 6.1 Calibration: Limit Strategies for Laboratory Assay Data 141 6.1.1 Definition Calibration 141 6.2 Limit Strategies 142 6.2.1 Example Estimation of LoB and LoD for Drug Assay 142 6.2.2 LoQ Results 144 6.2.3 A Comparison of Empirical and Statistical Approaches to the LoD and LoQ 145 6.2.4 Example LoD/LoQ, GC MS Approach 145 6.2.5 LoD/LoQ, GC MS Approach 146 6.2.6 Explanation of the Difficulty of the Statistical Methodology for the LoD and LoQ 147 6.2.7 Another LoQ Method 151 6.3 Method Detection Limits (EPA) 151 6.3.1 Method Detection Limits 151 6.3.2 Example Atrazine by Gas Chromatography (GC) 152 6.3.3 LoD and LoQ Summary 153 6.4 Data Near the Detection Limits 154 6.4.1 Biased Estimators 154 6.4.2 Computing Some Statistics with the LoD in the Data 154 6.5 More on Statistical Management of Nondetects 156 6.5.1 Model-Based Examples of Measuring Nondetects 157 6.5.2 An Alternative Regression Approach with Improvements (Refer to the Box Cox Transformation in Chapter 5) 160 6.5.3 Extension of the ROS Method for Multiple NDs in Various Positions 163 6.5.4 Cohen s Adjustment 165 6.6 The Kaplan Meier Method (Nonparametric Approach) for Analysis of Laboratory Data with Nondetects 170 References 174 7 CALIBRATION BIAS 177 7.1 Error 177 7.1.1 Types of Error 179 7.2 Uncertainty 180 7.3 Sources of Uncertainty 180 7.4 Estimation Methods of Uncertainty 181 7.4.1 Statistical Estimation Methods of Type A Uncertainty 181 7.4.2 Estimation Methods of Type B Uncertainty 183 7.4.3 Estimation Methods of Combined and Expanded Uncertainties (Normal Data) 187 7.4.4 Estimation Methods of Combined and Expanded Uncertainties (Nonnormal Data) 190 7.4.5 Another Method of Estimating Uncertainties for Nonnormal Data (Nonparametric) 192 7.5 Calibration Bias 194 7.5.1 Gas Chromatographic/Mass Spectrometric (GC MS) Calibration Bias 197 7.5.2 Discussion 205 7.6 Multiple Instruments 205 7.7 Crude Versus Precise Methodologies 208 References 210 8 ROBUSTNESS AND RUGGEDNESS 213 8.1 Introduction 213 8.2 Robustness 214 8.3 Ruggedness 216 8.4 An Alternative Procedure for Ruggedness Determination 224 8.5 Ruggedness and System Suitability Tests 227 8.5.1 Determining the SST Limits from Replicated Experimentation 228 8.5.2 Determining the SST Limits from Statistical Prediction 231 References 233 Index 235 |
| Author | Alfred Bartolucc |
| ISBN/ISSN | 9781118736869 |
| Binding | Hardback |
| Edition | 1 |
| Publisher | John Wiley |
You must be logged in to post a review.

Reviews
There are no reviews yet.